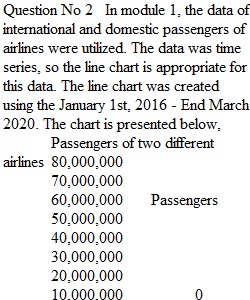


Q Running head: 2.3 DATA ASSIGNMENT 1 1. Using the data in Table 2.3 in the textbook(Springer/Hunt Library), Links to an external site.recreate Figures 2.3 and 2.4 from the textbook. 2. You have some data that was collected in Module 1. This was time-series data. Create a graph of the first data set (that was the entire series collected). Take a look at the plot you created. What do you see? What can explain any issues/trends you note? (Hint: Don’t make addressing this question harder than it should be; this is not a trick question.) Save your assignment using a naming convention that includes your first and last name and the activity number (or description). Do not add punctuation or special characters. Submit your assignment by the end of the module week. This activity supports Module Objective 2 and Learning Outcomes 5 & 9.
View Related Questions